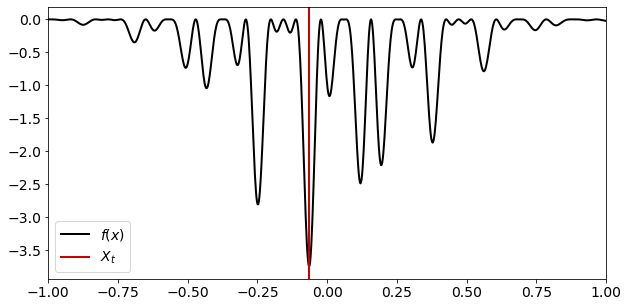
Example 5.18#
This is the simulated annealing example.
import numpy as np
import matplotlib.pyplot as plt

rng = np.random.default_rng(12345)

def f(x):
    return - (np.cos(50*x) + np.sin(20*x))**2 * np. exp(-5 * x**2)

T = 1000
x = np.zeros(T)

x[0] = rng.uniform(-1, 1)

fig = plt.figure(figsize=(10, 5))

for t in range(1, T):
    x_prop = x[t-1] + rng.normal(0, 0.1)
    u = rng.uniform(0, 1)
    beta_t = (1 + t)**0.5
    if np.log(u) < (f(x[t-1]) - f(x_prop)) * beta_t:
        x[t] = x_prop
    else:
        x[t] = x[t-1]

plt.clf()
plt.rcParams.update({'font.size': 14})
xx = np.linspace(-1, 1, 1000)
plt.plot(xx, f(xx), 'k', label='$f(x)$', linewidth=2)
plt.axvline(x[-1], color=[0.8, 0, 0], label='$X_t$', linewidth=2)
plt.xlim(-1, 1)
plt.legend()
<matplotlib.legend.Legend at 0x11ab6c490>