Example 2.5#
In what follows, we will implement transformation methods for sampling continuous distributions.
Example 2.5. Let us implement the transformation method where
\[\begin{align*}
X_1 &\sim \text{Exp}\left(\frac{1}{2}\right), \\
X_2 &\sim \text{Unif}(-\pi, \pi),
\end{align*}\]
and
\[\begin{align*}
Y_1 &= \sqrt{X_1} \cos X_2 \\
Y_2 &= \sqrt{X_1} \sin X_2.
\end{align*}\]
import numpy as np
import matplotlib.pyplot as plt

rng = np.random.default_rng(123)

N = 1000000
x_1 = rng.exponential(1/2, N)
x_2 = rng.uniform(-np.pi, np.pi, N)

y_1 = np.sqrt(x_1) * np.cos(x_2)
y_2 = np.sqrt(x_1) * np.sin(x_2)

# plot 2d histogram of y_1 and y_2
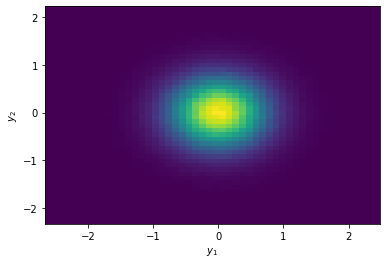
plt.hist2d(y_1, y_2, bins=50)
plt.xlabel('$y_1$')
plt.ylabel('$y_2$')
plt.show()

