Example 2.13#
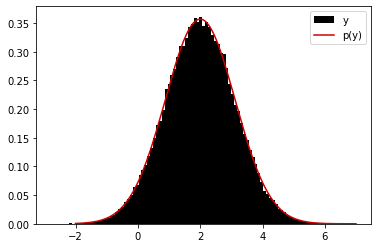
As stated in notes, we aim at comparing two procedures. First,
Sample \(X \sim \mathcal{N}(x;\mu,\sigma^2)\),
Sample \(Y | X = x \sim \mathcal{N}(y; x, 1)\)
and comparing resulting \(Y\) samples to
\(Y \sim p(y) = \mathcal{N}(y; \mu, \sigma^2 + 1)\).
By analytical results, they must match.
import numpy as np
import matplotlib.pyplot as plt

rng = np.random.default_rng(12)

mu = 2
sigma = 0.5

N = 100000
x = np.zeros(N)
y = np.zeros(N)

# We use rng.normal for this
# Note that rng.normal takes the standard deviation as the second argument
# You can use Box-M\"uller transform to sample Gaussians too

for i in range(N):
    x[i] = rng.normal(mu, sigma, 1)
    y[i] = rng.normal(x[i], 1, 1)

def marginal_y(z, mu, sigma):
    return np.exp(-0.5 * (z-mu)**2/(sigma**2 + 1)) / np.sqrt(2 * np.pi * (sigma**2 + 1))

yy = np.linspace(-2, 7, 1000)
plt.hist(y, bins=100, density=True, label='y', color='black')
plt.plot(yy, marginal_y(yy, mu, sigma), label='p(y)', color=[0.8, 0, 0])
plt.legend()
plt.show()
<ipython-input-1-e73d65d55468>:18: DeprecationWarning: Conversion of an array with ndim > 0 to a scalar is deprecated, and will error in future. Ensure you extract a single element from your array before performing this operation. (Deprecated NumPy 1.25.)
  x[i] = rng.normal(mu, sigma, 1)
<ipython-input-1-e73d65d55468>:19: DeprecationWarning: Conversion of an array with ndim > 0 to a scalar is deprecated, and will error in future. Ensure you extract a single element from your array before performing this operation. (Deprecated NumPy 1.25.)
  y[i] = rng.normal(x[i], 1, 1)