Example 2.12#
Let us now implement Example 2.12 of the lecture notes.
import numpy as np
import matplotlib.pyplot as plt
# Sampling from Gamma(2,1) using rejection sampling
# Gamma(alpha, 1) density
def gamma_density(x, alpha):
return x**(alpha - 1) * np.exp(-x) / np.math.factorial(alpha - 1)
def exponential_density(x, lam):
return lam * np.exp(-lam * x)
def M(alpha, lam):
return ((alpha - 1)/(1 - lam))**(alpha - 1) * np.exp(-(alpha - 1)) / (lam * np.math.factorial(alpha-1))
def gamma_rejection_sampling(alpha, lam, n):
x = np.array([])
acc = 0
for i in range(n):
x_prime = np.random.exponential(1/lam)
u = np.random.uniform(0, 1)
if u < gamma_density(x_prime, alpha) / (M(alpha, lam) * exponential_density(x_prime, lam)):
x = np.append(x, x_prime)
acc += 1
return x, acc/n
alpha = 2
lam_1 = 0.01
n = 10000
x_lam_1, acc_rate_1 = gamma_rejection_sampling(alpha, lam_1, n)
alpha = 2
lam_2 = 1/alpha
x_lam_2, acc_rate_2 = gamma_rejection_sampling(alpha, lam_2, n)
xx = np.linspace(0, 10, 100)
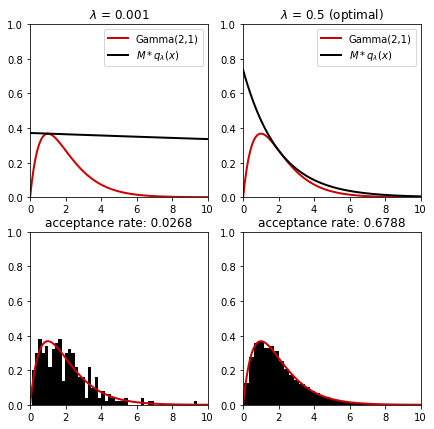
fig, axs = plt.subplots(2, 2, figsize=(7, 7), width_ratios=[1, 1], height_ratios=[1, 1])
axs[0, 0].plot(xx, gamma_density(xx, alpha), color=[0.8, 0, 0], linewidth=2)
axs[0, 0].plot(xx, M(alpha, lam_1) * exponential_density(xx, lam_1), color='k', linewidth=2)
axs[0, 0].set_xlim(0, 10)
axs[0, 0].set_ylim(0, 1)
axs[0, 0].set_title('$\lambda$ = 0.001')
axs[0, 0].legend(['Gamma(2,1)', '$M * q_\lambda(x)$'])
axs[0, 1].plot(xx, gamma_density(xx, alpha), color=[0.8, 0, 0], linewidth=2)
axs[0, 1].plot(xx, M(alpha, lam_2) * exponential_density(xx, lam_2), color='k', linewidth=2)
axs[0, 1].legend(['Gamma(2,1)', '$M * q_\lambda(x)$'])
axs[0, 1].set_xlim(0, 10)
axs[0, 1].set_ylim(0, 1)
axs[0, 1].set_title('$\lambda$ = 0.5 (optimal)')
axs[1, 0].plot(xx, gamma_density(xx, alpha), color=[0.8, 0, 0], linewidth=2)
axs[1, 0].hist(x_lam_1, bins=50, density=True, color='k', alpha=1)
axs[1, 0].set_xlim(0, 10)
axs[1, 0].set_ylim(0, 1)
axs[1, 0].set_title('acceptance rate: ' + str(acc_rate_1))
axs[1, 1].plot(xx, gamma_density(xx, alpha), color=[0.8, 0, 0], linewidth=2)
axs[1, 1].hist(x_lam_2, bins=50, density=True, color='k', alpha=1)
axs[1, 1].set_xlim(0, 10)
axs[1, 1].set_ylim(0, 1)
axs[1, 1].set_title('acceptance rate: ' + str(acc_rate_2))
plt.show()
<ipython-input-1-2ba40bbaca18>:8: DeprecationWarning: `np.math` is a deprecated alias for the standard library `math` module (Deprecated Numpy 1.25). Replace usages of `np.math` with `math`
  return x**(alpha - 1) * np.exp(-x) / np.math.factorial(alpha - 1)
<ipython-input-1-2ba40bbaca18>:14: DeprecationWarning: `np.math` is a deprecated alias for the standard library `math` module (Deprecated Numpy 1.25). Replace usages of `np.math` with `math`
  return ((alpha - 1)/(1 - lam))**(alpha - 1) * np.exp(-(alpha - 1)) / (lam * np.math.factorial(alpha-1))