Example 2.6#
Next we look at Example 2.6.
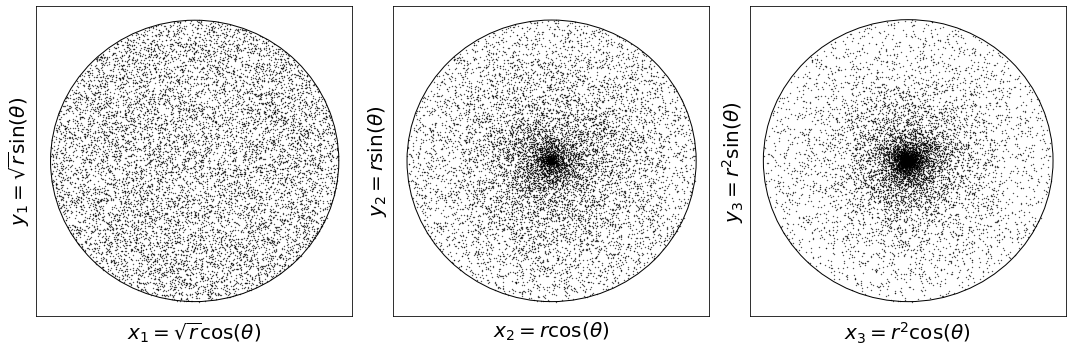
Example 2.6. Let us implement the transformation method where
\[\begin{align*}
r &\sim \text{Unif}(0, 1), \\
\theta &\sim \text{Unif}(-\pi, \pi),
\end{align*}\]
and
\[\begin{align*}
x_1 &= \sqrt{r} \cos \theta \\
x_2 &= \sqrt{r} \sin \theta.
\end{align*}\]
import numpy as np
import matplotlib.pyplot as plt

rng = np.random.default_rng(123)

n = 10000

r = rng.uniform(0, 1, n)
theta = rng.uniform(-np.pi, np.pi, n)

x1 = np.sqrt(r) * np.cos(theta)
y1 = np.sqrt(r) * np.sin(theta)

x2 = r * np.cos(theta)
y2 = r * np.sin(theta)

x3 = r**2 * np.cos(theta)
y3 = r**2 * np.sin(theta)

# draw a unit circle and plot x, y samples within it
fig, ax = plt.subplots(1, 3, figsize=(15, 5))

ax[0].add_artist(plt.Circle((0, 0), 1, color='k', fill=False))
ax[0].scatter(x1, y1, s=0.1, c='k')
ax[0].set_xlabel("$x_1 = \\sqrt{r} \\cos(\\theta)$", fontsize=20)
ax[0].set_ylabel("$y_1 = \\sqrt{r} \\sin(\\theta)$", fontsize=20)
ax[0].set_xticks([])
ax[0].set_yticks([])
ax[1].add_artist(plt.Circle((0, 0), 1, color='k', fill=False))
ax[1].scatter(x2, y2, s=0.1, c='k')
ax[1].set_xlabel("$x_2 = r \\cos(\\theta)$", fontsize=20)
ax[1].set_ylabel("$y_2 = r \\sin(\\theta)$", fontsize=20)
ax[1].set_xticks([])
ax[1].set_yticks([])
ax[2].add_artist(plt.Circle((0, 0), 1, color='k', fill=False))
ax[2].scatter(x3, y3, s=0.1, c='k')
ax[2].set_xlabel("$x_3 = r^2 \\cos(\\theta)$", fontsize=20)
ax[2].set_ylabel("$y_3 = r^2 \\sin(\\theta)$", fontsize=20)
ax[2].set_xticks([])
ax[2].set_yticks([])

fig.tight_layout()
plt.show()